
Retail Sales Look Strong Until You Take Out Gas
Retail sales rose 6.8% in a year, but gas stations did a third of the lifting. See what the October report says about real spending and your own budget.
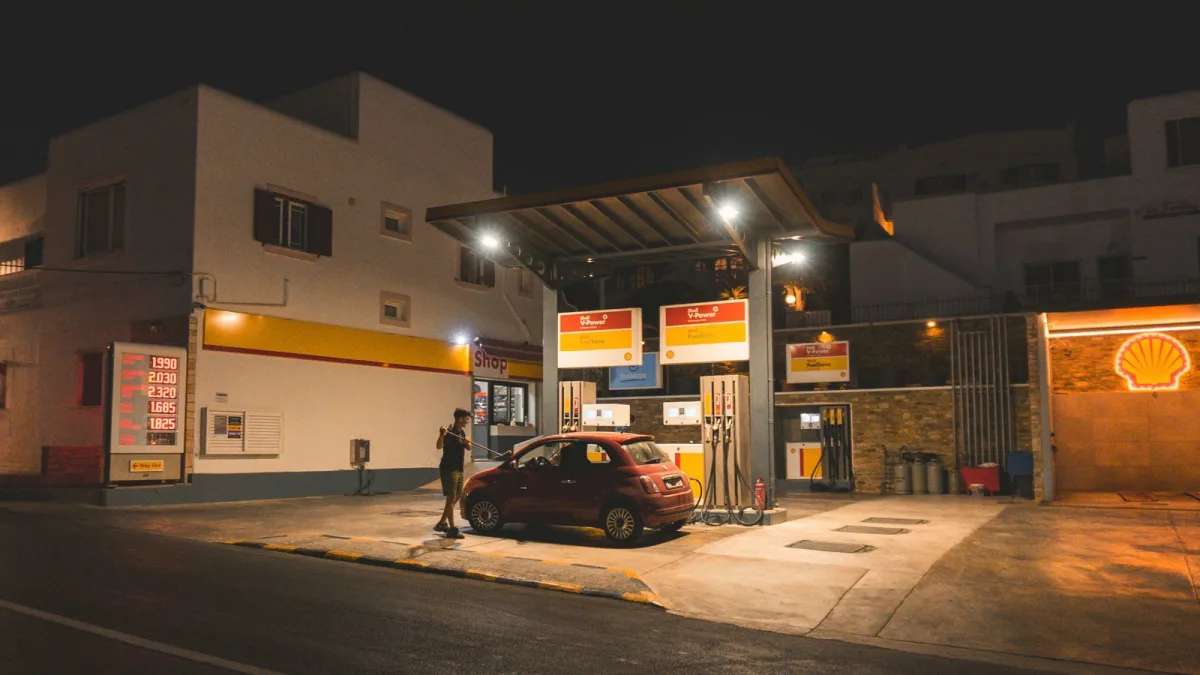
Table of contents
You fill the tank on Sunday, buy groceries on Monday, and order a few things online on Tuesday. By Friday your card statement looks heavier than it did a year ago, yet your cart and your closet look about the same. Then a headline tells you retail sales are up almost 7% and shoppers are spending freely.
Both things can be true at once. The latest retail sales report from the Census Bureau shows Americans spent more dollars in October, but a big slice of those dollars went to gasoline that simply costs more. Strip out gas and higher prices, and the picture of a booming shopper gets a lot thinner.
This guide walks through what the October numbers actually say, where the growth came from, and how to run the same math on your own budget so a headline does not fool you.
What the October Retail Sales Report Actually Said
The Census Bureau released its advance monthly retail report on November 17. Total sales for retail stores and restaurants came to $748.2 billion in October, after adjusting for seasonal swings and holidays.
That was up 0.2% from September. The Census Bureau flags that number with an asterisk: the margin of error is plus or minus 0.4%, so it cannot rule out that sales were flat. September's 0.8% jump was left unrevised.
The year-over-year number is the one that makes headlines. Sales were up 6.8% from October a year ago, and up 6.4% for the three months from August through October. Those are big numbers. But the report is not adjusted for prices, and that detail does most of the work in this story.
The categories that moved
Here is how the main store types changed from September to October, and over the full year:
- Gas stations: up 1.5% on the month, up 30.3% on the year
- Online and other nonstore retailers: up 1.2% on the month, up 11.8% on the year
- Restaurants and bars: up 0.2% on the month, up 7.0% on the year
- Grocery and beverage stores: down 0.2% on the month, up 0.9% on the year
- Car and parts dealers: down 1.6% on the month, up 1.3% on the year
- Furniture stores: down 2.3% on the month
Read that list from the top down and a pattern jumps out. The categories growing fastest are the ones where prices rose fastest, or where shopping simply moved online. The categories that shrank are the ones people can postpone, like a new couch or a new car.
Gas Did a Third of the Lifting
Gas stations are a modest part of retail. In October they took in about $68.6 billion of the $748.2 billion total, or roughly 9% of all retail sales.
Now look at the growth. Total adjusted sales rose by about $47.8 billion compared with October a year earlier. Gas stations alone added about $16.0 billion of that. So a category that is one-eleventh of the pie delivered about one-third of the year's sales growth.
That is why the Census report also publishes a total that excludes gas stations. On that measure, sales rose only 0.1% in October and 4.9% over the year. The gap between 6.8% and 4.9% is mostly the price of fuel.
Are people buying more gas, or just paying more for it?
Mostly the second. The Bureau of Labor Statistics reported in its September consumer price report that the gasoline index was up 34.2% over 12 months. Gas station sales grew 30.3% over a similar stretch.
When the money spent rises more slowly than the price, the number of gallons sold has to be flat or falling. A rough comparison suggests drivers bought a few percent less fuel than a year earlier, not more. (Gas stations also sell snacks and drinks, so treat this as a direction, not a precise gallon count.)
Real Spending Slipped in October
Retail sales figures count dollars. To see whether people bought more things, you have to subtract inflation.
The BLS October consumer price report, released November 10, showed prices up 0.4% for the month. Retail sales rose 0.2%. Prices rose faster than spending, so the volume of goods and meals people bought dipped by roughly 0.2% in October.
One wrinkle: the BLS could not publish 12-month inflation rates for October, because data for October of last year is missing. The most recent full-year figure is September's, when prices were up 3.7% over 12 months. Using that as a stand-in, 6.8% nominal growth works out to something closer to 3% in real terms.
Groceries tell the clearest story
Food is where the squeeze shows up most plainly. Grocery store sales fell 0.2% in October while the BLS food index rose 0.5%. Over the year, grocery sales grew 0.9% while food-at-home prices were up 1.8% as of September.
Put simply, households are paying more and carrying home less. That fits with what we covered in our look at rising wholesale prices and what reaches your cart next: cost increases at the producer level tend to show up on store shelves with a lag.
The Part of Retail Sales That Is Still Growing
Not everything in the report is a price story. Economists often watch sales excluding cars and gas, because those two swing the most from month to month. That measure rose 0.5% in October and 5.9% over the year.
Prices for everything except food and energy rose 0.3% in October, according to the BLS. So spending outside cars and gas grew a little faster than prices. That is a modest real gain, not a boom, but it is not a collapse either.
Two places carried it:
- Online shopping. Nonstore retailers grew 11.8% over the year, well ahead of inflation. Part of that is people switching where they buy, not buying more overall.
- Eating out. Restaurant and bar sales were up 7.0% on the year. Menu prices have been rising too, so some of this is price, but people are still choosing to spend here.
Meanwhile, the big-ticket categories are soft. Car dealer sales fell 1.6% in October and furniture stores fell 2.3%. When households feel stretched, these are the purchases they delay first.
Run the Math on Your Own Budget
Here is a worked example that shows how a family's store spending can rise sharply without them buying a single extra item.
Say your household spent $4,000 a month at stores last October, and $360 of that (about 9%, matching the national share) went to gas.
- Gas: With pump prices up 34.2%, the same gallons now cost about $483. That is $123 more each month.
- Everything else: The other $3,640 of purchases, rising at the 2.6% pace of prices outside food and energy, now costs about $3,735. That is $95 more.
- Total: Your monthly spending is now about $4,218, up 5.5%.
You did not upgrade anything. You did not buy more. Your spending still rose 5.5%, and in the national data you would look like a confident shopper. That is the same effect hiding inside the 6.8% headline.
You can test your own numbers with our inflation calculator. Plug in what a regular month cost you a year ago, then compare it with what the same basket costs now. If the gap is bigger than your raise, your real spending power has shrunk even if your card statement says otherwise.
Three moves that help right now
- Track fuel as its own line. If gas has climbed from 9% to 12% of your spending, that is money coming straight out of something else. Seeing it separately makes the tradeoff visible.
- Watch grocery unit prices, not totals. A smaller receipt can still mean you paid more per pound. Compare the per-unit price on the shelf tag.
- Hold back on big-ticket buys if you can. Weak furniture and car sales put pressure on sellers. Discounting tends to follow soft demand, especially heading into year-end promotions.
If you are planning for December, our breakdown of why holiday budgets run out early covers how to build in a buffer for exactly this kind of price creep.
Frequently Asked Questions
Are retail sales adjusted for inflation?
No. The Census Bureau reports retail sales in current dollars, adjusted for seasonal patterns and holidays but not for price changes. To estimate real spending, compare the sales change with the change in consumer prices from the BLS over the same period.
Why did retail sales go up if people are buying less?
Because higher prices raise the dollar value of the same purchases. In October, gas station sales were up 30.3% on the year while gasoline prices were up about 34%, so drivers paid more for roughly the same or fewer gallons.
What does retail sales excluding autos and gas mean?
It is total retail sales with car dealers and gas stations removed. Those two categories swing sharply with car deals and fuel prices, so removing them gives a steadier view of everyday spending. In October that measure rose 0.5% on the month and 5.9% on the year.
When is the next retail sales report released?
The Census Bureau has scheduled the November advance retail sales report for December 16. It will be the first official read on holiday season spending.
Do strong retail sales mean the economy is healthy?
Not on their own. A rising dollar total can come from higher prices rather than more buying. Look at sales excluding gas, compare growth with inflation, and check whether big-ticket categories like cars and furniture are growing or shrinking.
The Bottom Line
The October retail sales report looks strong on the surface, with sales up 6.8% in a year. Underneath, gas stations supplied a third of that growth, grocery volumes are slipping, and total spending failed to keep pace with prices for the month.
The steadier core of spending is still growing a little faster than inflation, mostly online and at restaurants. So the honest read is a shopper who is stretched but still spending, not one on a spree. The December 16 report will show whether that holds through the holidays. Until then, judge your own finances by what your money buys, not by how many dollars leave your account.
Disclaimer: This article is for informational purposes only and does not constitute financial advice. Always consult with a qualified financial advisor before making investment decisions. Past performance is not indicative of future results.
Written by
Marcus Vance
Business & Money
Writes on business and personal finance for Quick Trend Insights, translating markets, rates, and company strategy into what it costs or saves a household.
Related Articles
View all
Wholesale Prices Are Up 6.5%: What Hits Your Cart Next
Wholesale prices are up 6.5%, and much of it has not reached stores yet. See which costs hit your cart first and which purchases to time before prices catch up.

India Inflation Crosses 6%: What It Costs Your EMI and FD
India inflation hit 6.09% in October, above the RBI ceiling. See what a December rate hike adds to your home loan EMI and why your FD is losing money after tax.
Bank of England Rate Rise: Should You Fix or Track?
The Bank of England rate rise to 4% hits trackers first and fixes at renewal. See what it adds to your mortgage, and when a fix or a tracker costs you less.